Week of Hustle - Day 5
Today's productivity was very non-uniform. Almost whole day I had to work on another project and finally in the evening I could continue. I was thinging a lot about what would be the most suitable way of implementing the visualization via circular sectors. Finally I've managed to implement a viable prototype.
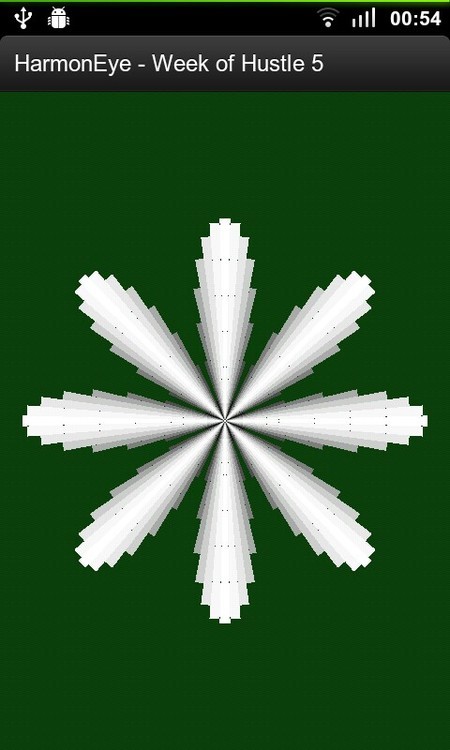
After yesterday's GLSL playground I've decided to get hand dirty with vertex buffers, triangles and transformation matrices. I'll have to use it someday, so why to today. So the result is this simple application that given an array of values draws the properly sized circular segments (as triangles) and colors them simple from black to white. On the screenshot there is a plot of a function derived from cosine. What needs to be plotted is a sampled parametric plot in polar coordinates, but not just the line, but rather what is under the line.
It isn't visually most appealing, but it should be sufficient for a prototype to carry the necessary data. From now it can be only nicer :)
Tomorrow's task is to merge this visualization with the computation code and to make the plot less ugly. The original temperature-scale color function should be used and the borders and tone names are missing now.
Comments
Comments powered by Disqus